Carbon Activity#
This example shows the calculation of the carbon activity for methane mixtures in thermodynamic equilibrium.
import gaspype as gp
import numpy as np
import matplotlib.pyplot as plt
Setting temperatures and pressure:
t_range = np.array([600, 700, 800, 900, 1100, 1500])  # °C

p = 1e5  # Pa

fs = gp.fluid_system(['H2', 'H2O', 'CO2', 'CO', 'CH4'])
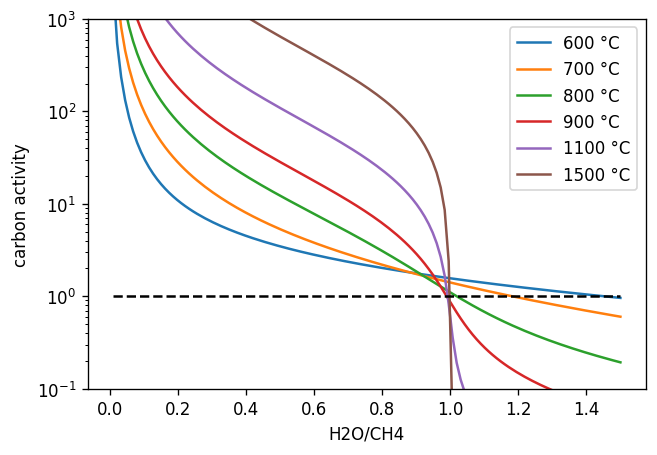
Equilibrium calculation for methane steam mixtures:
ratio = np.linspace(0.01, 1.5, num=128)

fl = gp.fluid({'CH4': 1}, fs) + ratio * gp.fluid({'H2O': 1}, fs)
gaspype.carbon_activity supports currently only 0D fluids therefore we build this helper function:
def partial_c_activity(fl: gp.fluid, t: float, p: float):
    fls = fl.array_composition.shape

    eq_fl = gp.equilibrium(fl, t, p)

    ret = np.zeros(fls[0])
    for i in range(fls[0]):
        ret[i] = gp.carbon_activity(gp.fluid(eq_fl.array_composition[i,:], fs), t, p)

    return ret
Now we use the helper function to calculate the carbon activitx for all compositions in equilibrium_h2o times all temperatures in t_range:
carbon_activity = np.vstack([partial_c_activity(fl, tc + 273.15, p) for tc in t_range])
Plot carbon activities, a activity of > 1 means there is thermodynamically the formation of sold carbon favored.
fig, ax = plt.subplots(figsize=(6, 4), dpi=120)
ax.set_xlabel("H2O/CH4")
ax.set_ylabel("carbon activity")
ax.set_ylim(1e-1, 1e3)
ax.set_yscale('log')
ax.plot(ratio, carbon_activity.T)
ax.hlines(1, np.min(ratio), np.max(ratio), colors='k', linestyles='dashed')
ax.legend([f'{tc} °C' for tc in t_range])
<matplotlib.legend.Legend at 0x7f84bf592510>
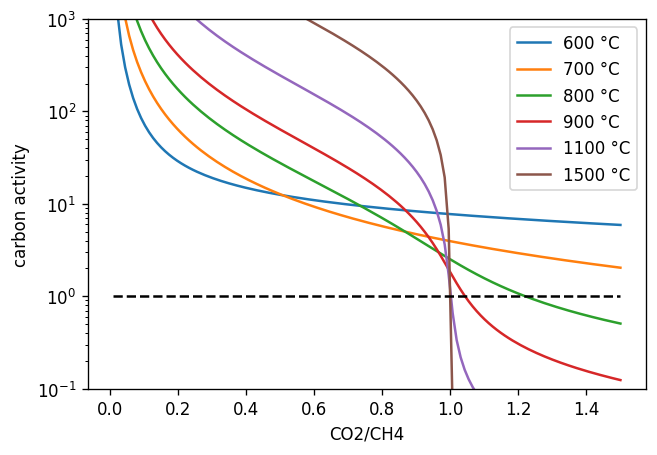
Let’s do the equilibrium calculation for methane CO2 mixtures as well:
fl_co2 = gp.fluid({'CH4': 1}, fs) + ratio * gp.fluid({'CO2': 1}, fs)
carbon_activity_co2 = np.vstack([partial_c_activity(fl_co2, tc + 273.15, p) for tc in t_range])
And plot carbon activities over the CO2 to CH4 ratio:
fig, ax = plt.subplots(figsize=(6, 4), dpi=120)
ax.set_xlabel("CO2/CH4")
ax.set_ylabel("carbon activity")
ax.set_ylim(1e-1, 1e3)
ax.set_yscale('log')
ax.plot(ratio, carbon_activity_co2.T)
ax.hlines(1, np.min(ratio), np.max(ratio), colors='k', linestyles='dashed')
ax.legend([f'{tc} °C' for tc in t_range])
<matplotlib.legend.Legend at 0x7f84bf0686e0>